The programmer’s national anthem is ‘AAAAAAAAHH’.
Weinberg
When it comes to statistics, at least for psychologists, SPSS is frequently used. It’s a statistical package originating from the mainframe computer generation, and it is/was widely used. It comes with GUI and you can click away to do the analyses you need to do. But it is also expensive, come with a yearly license, and is … well, not very adaptable. You can do the common stuff, but that’s it.
R, on the other hand, is available for free. It is also much faster, and provides much more options. And it runs via code (usually).
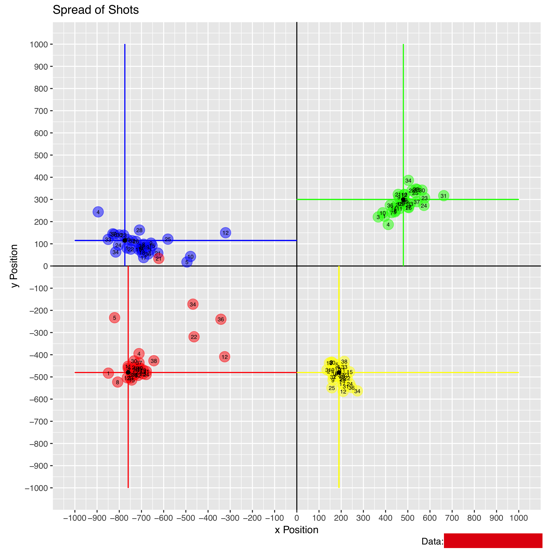
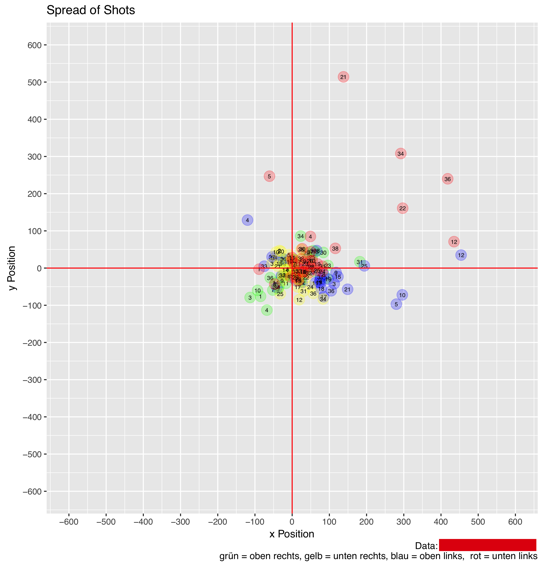
Given I grew up with SPSS, it took a while to get warm with R. It has a rather steep learning curve. But after giving it another shot, I’m impressed. Very impressed. It’s cool. Geek cool. Doing a t-test and getting the output as text you can copy and paste in a paper? R can do that. Using Pythagoras to calculate the mean distance to the target and justify it in the center of a coordinate system? Yup, works as well.
And frankly, if you are interested in learning R, I strongly recommend starting with Wickham’s and Grolemund’s “R for Data Science“. It is probably the best book on programming languages I have every read (if you think of R as a programming language). Very well written. And they start with visualization, which is really helpful. Giving that R is rather unforgiving when you make mistakes (note: when, not if). The whole book is accessible online. I also strongly recommend installing not only R but also R Studio, which makes the whole experience much smoother. And yeah, the tidyverse package is really helpful as well. Oh, and the ggplot2-cheatsheet.
So, yeah, highly recommended. It’s fun when statistics becomes interesting again and you go “if I combine x with y and send it to z it should work” … and it does work.