Begin challenging your own assumptions. Your assumptions are your windows on the world. Scrub them off every once in awhile, or the light won’t come in.
Alan Alda
The kind of data you are dealing with when you are doing science strongly depends on the (sub-)domain/methodological approach, so general tips are very difficult here. However, some issues should be common issues in nearly all disciplines.
Before you collect the data make sure you can use it to answer your questions
Before you collect any data play though how you will analyze the data.
One of the most gut-wrenching situations in science is when someone has collected a lot of data (and burned a lot of time, effort, money, material), and then finds out that a crucial variable is missing or has the wrong level. For example, in a web experiment I once (nearly) forgot to save the condition the subject was in — that would have been “very bad” if I had realized it after the study. Another person collected data on a categorical level (yes/no) but needed an interval level for analysis later. It can happen in other domains as well.
Yes, the time is short and you itch to begin data collection. In many disciplines, this is the most difficult and unpredictable phase (Will you get the necessary participants? Will there be enough data? Will the manipulation work?). However, all is for nothing if you cannot use the data to answer your questions.
Plan at least a week to generate data for the variables you collect (within the range of possible values), and then do a dummy analysis. You can generate data quite easily with R, you can even generate data as you would expect it to turn out (e.g., generate data where one group is better on average than the other). Then have a close look: Can you answer your research questions with this data? What would be possible next questions to ask? Can you answer them as well? If this is your first study in this sub-domain, talk it through it a colleague.
In any case, make sure to mark the files so that you do not confuse them later with the real data. Unfortunately, data fabrication happens in science and when it is not done to simply test whether you can analyze the data, it is the quickest way to destroy your career — and no-one will believe you that you have just confused the files. You might want to delete the data file after you are done, but keep the analysis scripts for the real analysis.
Again, time is short, but the time you invest here will (hopefully) catch any missing but crucial variables (careful of “variable creep” in science) and you save time when analyzing the real data later.
Make sure you understand the criteria for using the kinds of methods you want to use
I am not talking about the assumption of statistical methods (for these, see below), but about the standards that are expected if you want to publish your study. For example, if you create a new scale, you should be very familiar with scale construction and the requirements. If you want to do a Factor Analysis, you should know what you can do to get more reliable data (e.g., by using marker items). This goes a step further than just making sure you can use the methods you want to use, it means knowing what the community expects when you want to publish your data. So hit the literature beforehand and find out how other authors did do their studies, what they needed to analyze their data, and what this entailed.
In a good workgroup, others should point out these issues immediately, but many PhD students work on their own, even in “workgroups”. So make sure you know the community rules. In some cases, these community rules might even be lower than what you would normally like to do. For example, some reviewers request older statistical methods, despite newer (and also better) ones being available. Science has community standards and an inertia which you should know if your career (“publish or perish”) is affected by it.
Save your data files externally, and then save them again in another place, and then again
Hard-discs crash, notebooks get stolen, and, yes, you might accidentally delete or change your files. So make sure you secure your data files in a lot of different places. Personally, I send DVDs with data (encrypted) to my parents, 400 km away, despite having backups at home and at work. Collected data cannot be replaced, and errors and changes can happen quickly, so make sure you can go back to the original data. BTW, if you use encryption, take care not to lose the password or the private key file. This can happen too.
Document what you are doing when you analyze the data
Many will know the feeling — you finally got your data, the moment of truth has arrived. Will you find what you are looking for? The danger here is to run a couple of quick analysis and not document what you are doing. Many programs give you a syntax to save — which allows you to retrace your steps. This is not only needed when you write the paper to your study, but also when you want to find out why the hell two analyses differ when they should be the same.
BTW, saving the syntax is a good move in any case. If you routinely collect data that is analyzed in the same way, e.g., a standard questionnaire, make sure the variables are always named the same and you can quickly run the basic analyses with the same script. It’s more effort in the beginning, but then you save time. Just make very sure the script you are using works correctly. There have been cases, e.g., of a consultancy, that used scripts for years that had errors in it.
Annotate your Analyses
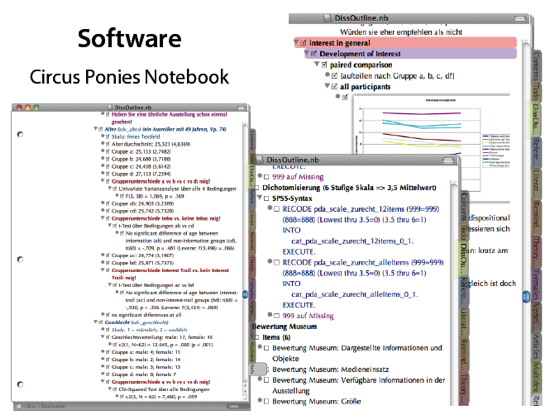
When you analyze the data, you will get ideas, e.g., why something did happen. While the results and discussion (= interpretation) sections are (and have to be) separate in a paper, you should write down your thoughts when analyzing the data immediately. Like with any ideas, these thoughts are fleeting and ephemeral. A few minutes later you will be thinking of something else and you might forget about that interpretation. So jot it down. Either in the script, or, perhaps better, by using a Circus Ponies Notebook or Word or OneNote file in which you copy the scripts, the results, and the interpretation.
I love Circus Ponies Notebook outliner function here — you can simply fold in the sections you do not need at the moment, much better than anything Word can offer (and much more stable). Just take care how you paste it into the file — Circus Ponies Notebook has different modes of pasting information, which strongly affect how the result looks like (check “Edit” – “Paste”).
Check the Assumptions
One frequently neglected issue (even by professionals) is the assumptions different analysis methods have. Statistics programs make it easy — they don’t check it despite knowing the scale level in the variable declarations! The worst example I have seen so far was a student who calculated an ANOVA with categorical variables as the dependent variables. SPSS did print out an analysis — although the method did not make sense here.
So, even as they are often neglected, check them. You might even profit from it, e.g., it might lead you to different methods and (more importantly) valid results. And if that does not convince you, perhaps this beautiful quotation by Andy Field will:
“Now, you may think that assumptions are not very exciting, but they can have great benefits: for one thing you can impress your supervisor/lecturer by spotting all of the test assumptions that they have violated throughout their career. You can then rubbish, on statistical grounds, the theories they have spent their lifetime developing — and they can’t argue with you.
Well, as I always say, ‘if you’re going to go through the agony of doing statistics, you may as well do them properly’.”
Andy Field (2005)
Look for Good Sources on Statistics (and make sure you understand them)
One thing that really surprised me when looking for literature about methodology and statistics was that sometimes you can find excellent (= very helpful) articles in really strange sources. When I was reading about Factor Analysis, I found a very helpful one in the “Southern Online Journal of Nursing Research”. Woppa … not exactly mainstream, but hello did it fill in some blanks.
In this regard, I can only recommend to be open to “strange sources”, as long as they are good. As a reviewer, I have also encountered authors who cited really high-level books (e.g., one about Principal Component Analysis), yet completely misrepresenting the authors points (and the method itself). Apparently, they assumed that a reviewer would not check their sources, not even if what they did sounded really, really strange.
In short, there are a lot of different sources available for nearly any topic. I think the variance is especially high when it comes to methodology and statistics. I had the misfortune to learn statistics with a very boring and unnecessary complex German book. It was only later when I encountered books that were really helpful to understand what statistics is all about.
And you need to know what statistics is about. Because the common quotations: “There are three kinds of lies: lies, damned lies, and statistics.” (Benjamin Disraeli) or “I only trust statistics I have faked myself” (can’t remember the source) — they hold true if you are not able to check them. They can be used to mislead people quite easily. But statistics are there for a reason: Human reasoning is limited, we make countless mistakes and have strong biases. We need a more objective way to come to conclusions, especially with complex data. So make sure you understand statistics to notice when it is not used correctly and when it is used correctly — an opens our eyes to things we cannot detect with our limited reasoning capabilities.
Personally, I recommend the following books:
- Field, A. (2005). Discovering Statistics Using SPSS (2nd Edition). London: Sage.
Very good book that tries to convey the importance of statistics. There is also a book on “R” and on “SAS” if you rather use these programs (R might be much better than SPSS). - Pallant, J. (2007). SPSS Survival Manual. McGraw-Hill, Open University Press.
Very easy to use yet surprisingly in-depth explanations of the common methods used in psychology/social science. If I would recommend any book for people who do not “have the time” to really go into the details of statistics, this would be it. Whether you are working in a company or are a bachelor student with a pressing dealing, this book will get you through your analysis. Check for the current edition. - Goodwin, C. J. (2009). Research in Psychology. Methods and Design. New York: Wiley.
Very well written book on methodology. Check for the current edition. - Wright, D. B. (2003). Making friends with your data: Improving how statistics are conducted and reported. British Journal of Educational Psychology, 73, 123-136.
Must read when you want to analyze your data. - Froman, R. D. (2001). Elements to Consider in Planning the Use of Factor Analysis. Southern Online Journal of Nursing Research, 2(5). Retrieved January 9, 2009, from http://www.snrs.org/ publications/SOJNR_articles/iss05vol02.pdf
A rather strange source yet surprisingly helpful. Don’t be discouraged by strange journal names. If you are not (yet) familiar with a method, these articles might be just what you need — pointing out the common pitfalls in a language you can understand.
So, happy, analysis. 🙂
Hello,
I enjoy your posts because they often make me think about how I go about my work.
You did point out that different fields do very different forms of data collection, but, I have a caveat to add to: “before you collect the data make sure you can use it to answer your questions” – I agree in principle, however, I collect data in a very remote location I can only access for a few weeks once a year. Before I go I create detailed plans to collect data that will answer my science questions using the standard analysis in my field. Then, I get on site and reality kicks in. I never get a perfect data set as I have to fit my work in with other work going on which requires compromise, plus weather can stop work and instruments can fail. When I get home, I’ve have to get creative on how I perform my analysis, and I’ve even had to tweak my science questions to something my data set will allow me to answer. Sometime you have to work with the data set you get.
Can I also suggest to leave a bit of room for just looking at the data. That is, put the science questions aside for a moment to see what else might be lurking in the data. In my current project, by doing this I’ve found something really interesting and unexpected that might lead me in a really interesting direction. (This may only work in some fields)
I also like your suggestion of consulting ‘strange sources’ – doing this has worked for me.
Cheers,
Jeannette
Hoi Jeannette,
you are right — what is planned and what happens are often … a little bit apart. But especially if you are operating outside of a ‘tried-and-true(or not)’ paradigm, you should play out what you do with the data. This might be more relevant for laboratory research, but still, imagine you had collected a lot of data and then returned home only to realize that you have forgotten to log an important variable. I would also suppose (but don’t know) that thinking deeply about what you want to do with the data you want to collect does help when you collect different data. Even if you cannot do the same analyses it should be in the back of your mind and you might play it through more quickly (but I’m guessing here).
Regarding the second issue, I also totally agree. Your hypotheses guide you and the methods allow you to see only a narrow view on the world. Still, as a first step it is very helpful to really look at the data, dig into them and find out what they imply. I think the problem here is that you can get fairly close to post-hoc reasoning. This digging in the data can lead to new hypotheses, but it needs new data to make sure that it is more than a fluke. In this regard I highly recommend the article by Alon ( Alon, U. (2009). How To Choose a Good Scientific Problem. Molecular Cell, 35(6), 726–728. doi:10.1016/j.molcel.2009.09.013 ). He argues nicely to be open for new directions in research.
All the best
Daniel