«The more you tighten your grip, the more star systems will slip through your fingers.»
Princess Leia Organa in «Star Wars»
Ah, R (okay, install RStudio as well). Never had the same reaction to any other statistics software as to this gem. Makes it really easy and fun to create plots — and do statistical analysis — if you invest the necessary amount to learn about it.
Recently, I saw this beautiful meme:
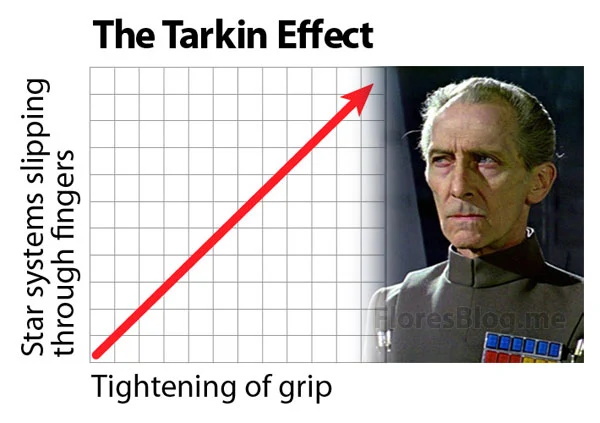
and decided to recreate it with R. Uses ggplot (just load the tidyverse package) and sure looks nice:
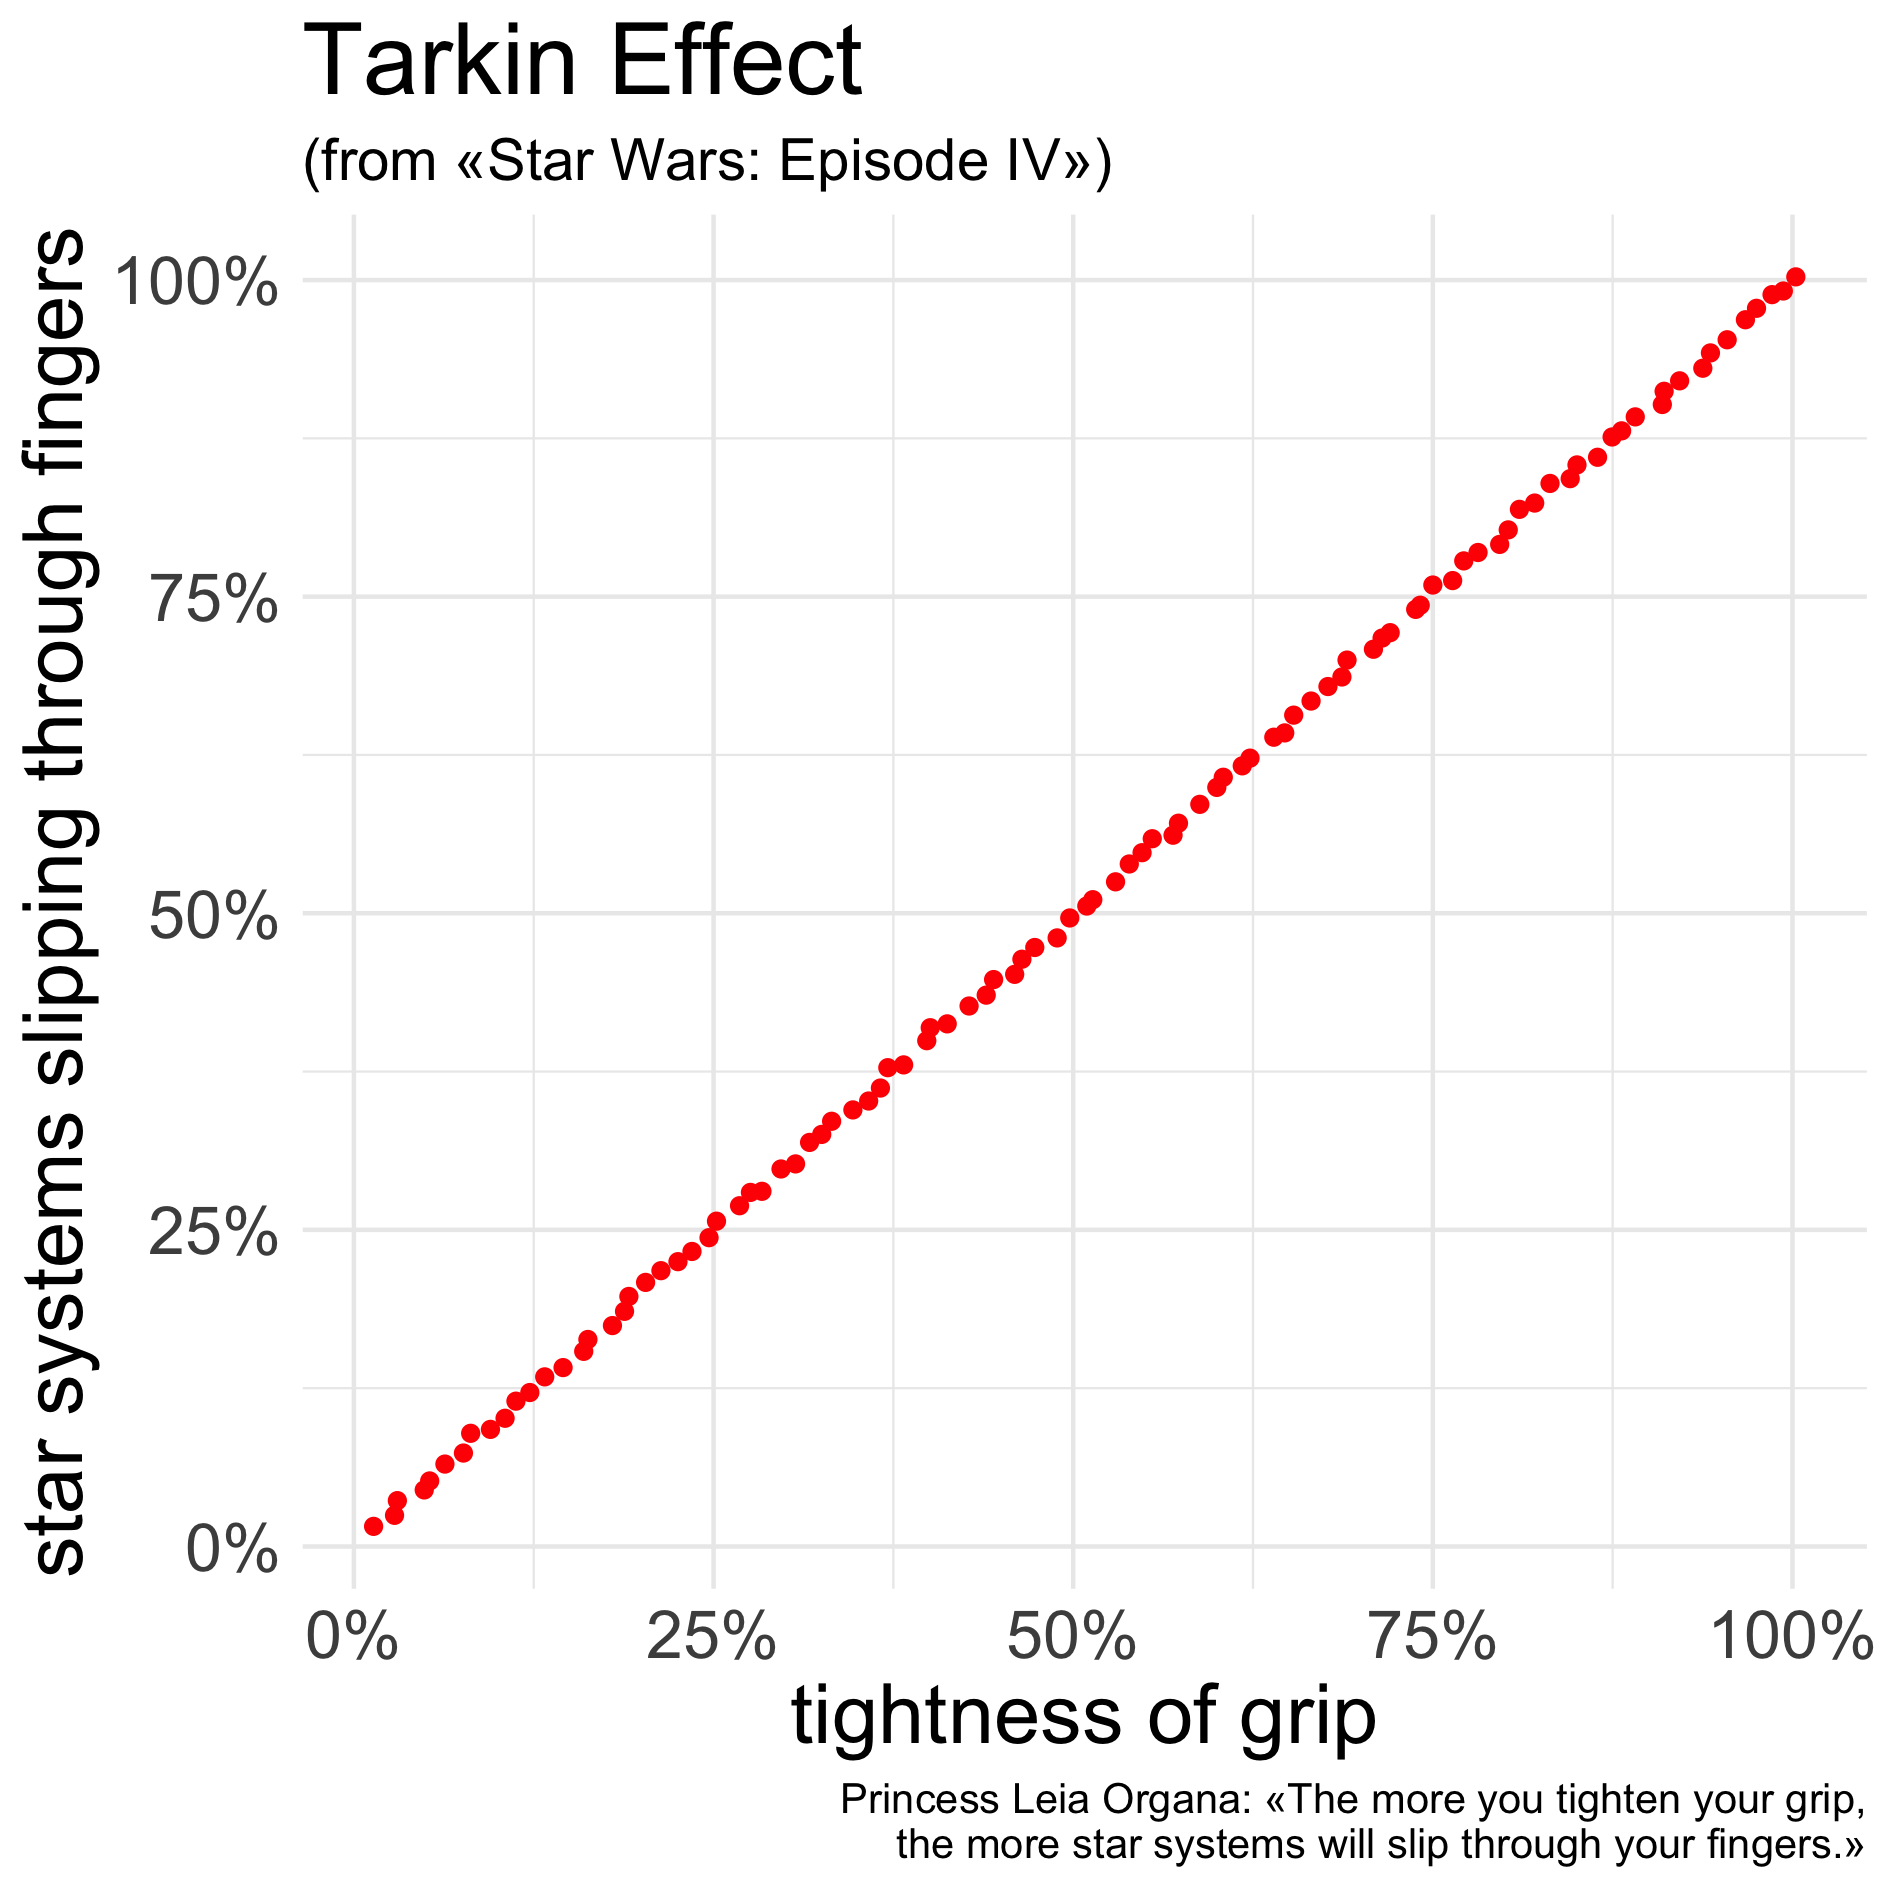
And only takes a few lines of code, of very specific code:
ggplot() +

geom_jitter(aes(x = seq(.01,1,.01), y = seq(.01,1,.01)), color = "Red") +

labs(title = "Tarkin Effect", subtitle = "(from «Star Wars: Episode IV»)",

x = "tightness of grip", y = "star systems slipping through fingers",

caption = "Princess Leia Organa: «The more you tighten your grip,

the more star systems will slip through your fingers.»") +

scale_x_continuous(labels = scales::label_percent()) +

scale_y_continuous(labels = scales::label_percent()) +

theme_minimal() +

theme(text = element_text(size=20),

plot.subtitle = element_text(size=14),

plot.caption = element_text(size=10))

ggsave("tarkin.png", width=16, height=16, units = "cm", dpi = 300)
And is also strangely suiting to the times we live in.
Have fun.