Walken [on TV]: «International law has no prohibition against any government, superpower or otherwise, targeting terrorist command and control centers. And Abdul Shareef was a walking command and control center.»
Reporter #4 [on TV]: «You stated that as Speaker, you knew of and supported the assassination. Do you now regret that support?»
Walken [on TV]: «My only regret is that we only got to kill the bastard once.»
Will: «The UN’s going to go crazy.»
«The West Wing»
Last year I really nailed the methodology and statistics course I (co-)lecture. Part of it (mostly the statistics part) is done by the psychology department (which is fine, I am a psycho by training, in more ways than one). But I did the methodology lectures, did the tutorials, create the written exam for the media and computer science students — the works. And did I prepare them for the exam. And it went really, really well. In the sense of 92% passed, compared the roughly 2/3 the years before.
The “secret”? Written tests that closely mimic the actual exam conditions. In the classroom, mandatory, and with the same surveillance as during a real exam. Not “nice”, not “supporting”, not “comforting”, but by the Gods, it did the job. You either were able to solve the questions on your own, or you failed the test. Which meant (if you did not pass a second trial) you were disqualified from writing the final exam.
Some students needed the wake-up call, but when that bell did ring, boy, did they go to work.
And then came Corona.
No more face-to-face tutorials and no more tests that closely mimic the exams. And it did show. Below are the results. Scatterplots of the test scores/percentages and the exam scores (different scales, but does not really matter):
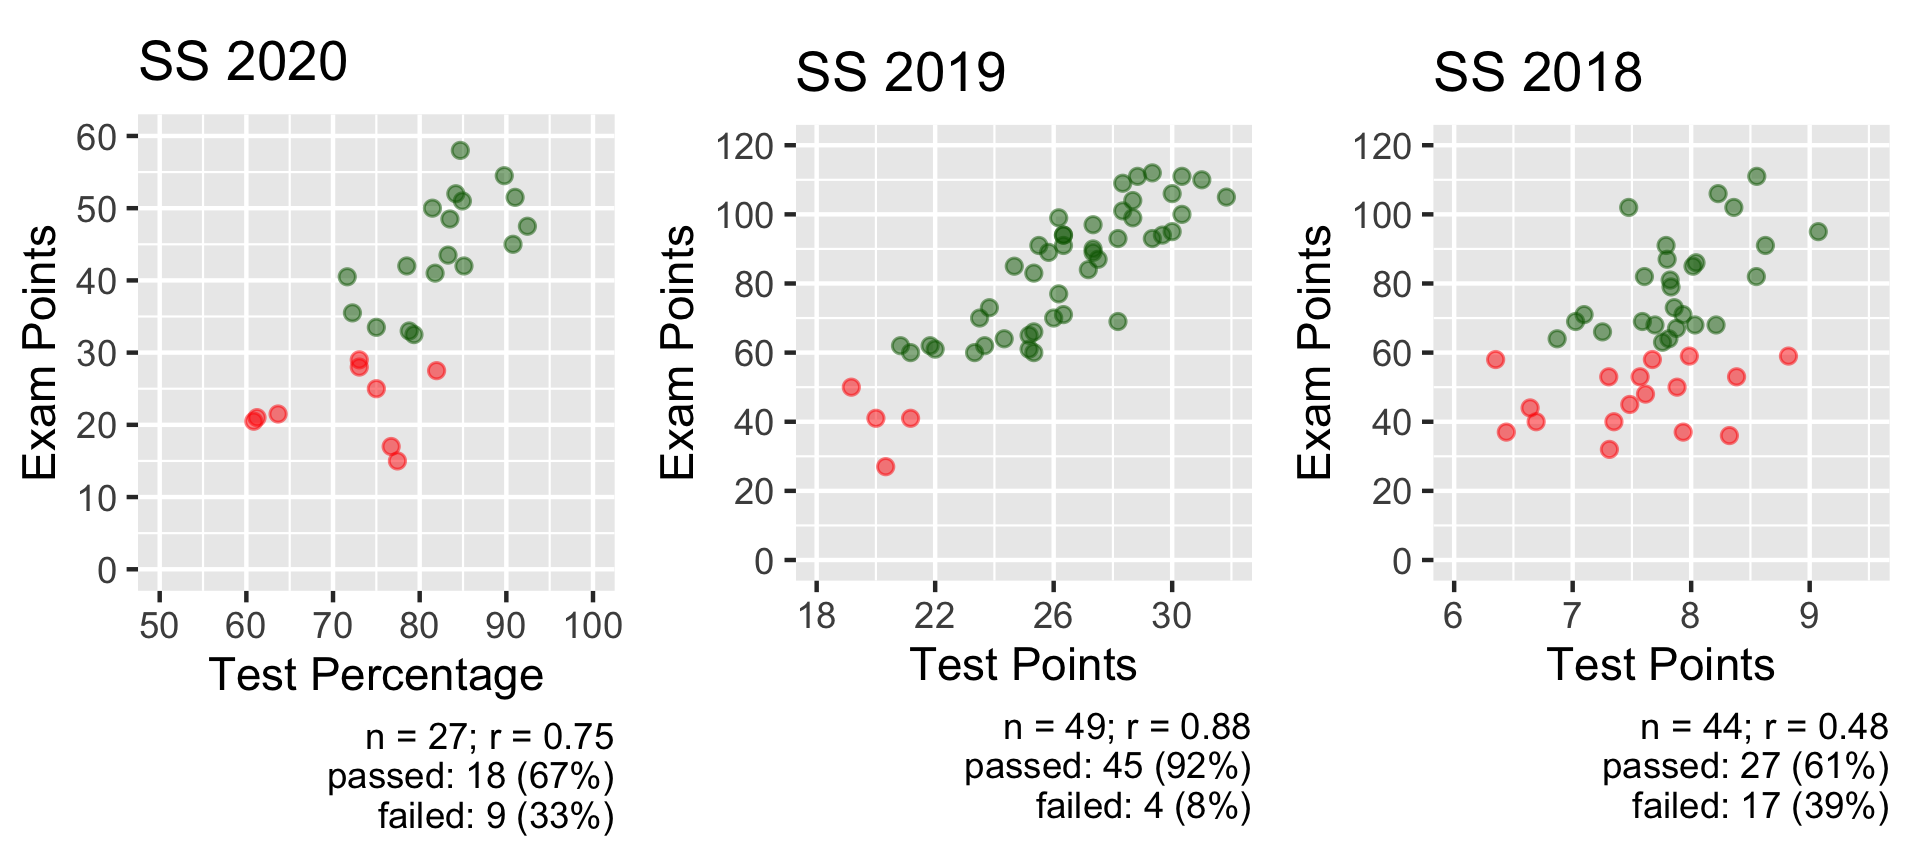
If you look at the scatterplots, 2018 was … well, there was a relationship, but a muddy one. Only r = .48. No wonder, tests were done online in the learning management software (Moodle) and students had a week to complete them. More than enough time to get the solution from “somewhere” (just not from one’s own brain).
In contrast, 2019 was … magnificent. A correlation of r = .88. If the criteria had been 60% instead of 50% of the test percentage, no one would have failed the exam (and only a few who passed would — perhaps, they might have stepped up their game — not gotten the permission to write the exam).
And then there’s 2020, this year. With exams done online, during a limited time frame (90 minutes or so), while having (depending on the exam) 30 to 45 minutes of time for the test itself. Ample time to cheat (and some did). It’s funny, plagiarism algorithms work really well. As does sorting the tests by the time they did submit it. They might mix up the formatting when talking online, they still (likely) submit at the same time.
So, 2020 is not as good as 2019, but not as worse as 2018. Still, I have to find a different solution for the next semester. It worked, but more is possible. Much more.
And in any case — I really recommend just digging in the data you have after an exam. There are some really interesting things you can find out about the students. And the better you know them, the better you can tailor your teaching to them.
After all, it really sucks to correct bad exams, it sucks even more to do it twice (or: gasp, even trice).
P.S.: Yeah, it’s only a correlation, it does not mean causation. If the students take one things with them, that might not be the worst. But still, even if the student generations (or anything else) did differ, there is something here …