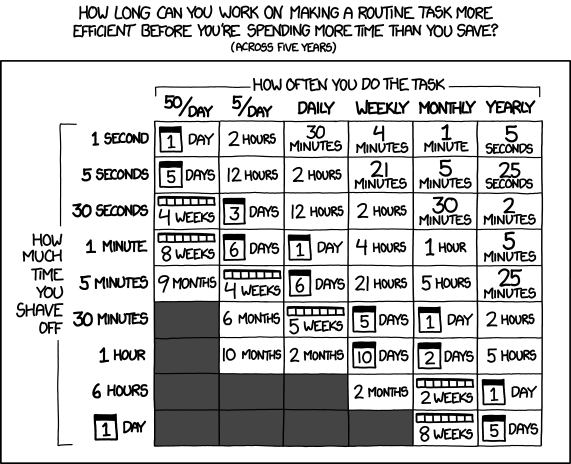
xkcd’s Randall Munroe has this brilliant graphic as comic today. If you ever wanted to find out when optimizing your task costs you more than it brings you, then this is extremely helpful. The time horizon is five years, a good time frame, because, seriously, in five years you are probably doing something else. Start vertically — How often do you do the task? — then look horizontally — How much time do you shave off? The cell at the intersection gives you the amount of time you can invest in optimizing the task. More than that and you actually lose time. For example, if you do a task daily (e.g., visiting a couple of websites), and you can save 1 minute each time by switching to RSS Feeds, then it makes sense to invest 1 day in optimizing this (third column “daily”, down to fourth line “1 minute”, the cell at the intersection is “1 day”).
Of course, this does not take into account the “chill factor” (or heat index if you look at it that way). After all, it’s not just physical measurements, your psychological health might profit by it, even if you actually put in more time than you get out of it — in mood, energy, and just the feeling that you control your environment, even if you made a time-loss. (The discussion about the comic strip at xkcd list’s a couple of other possible ‘improvements’, wonder if they are worth the time? ;-))
But still, brilliant work and a good orientation (and warning) when it comes to investing time in the infrastructure.