«The purpose of visualization is insight, not pictures.»
Ben Shneiderman
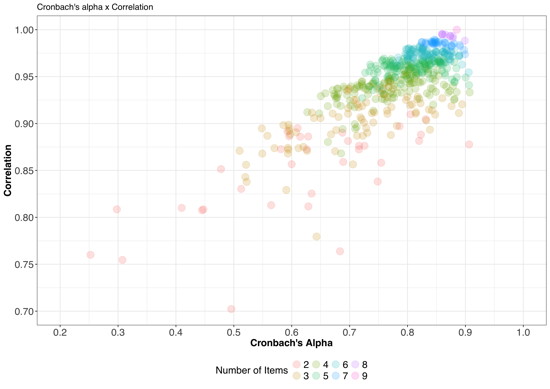
One of the things I’m currently doing is looking how to crate a short version of a scale. And damn, R is cool. Just playing around with the data, more or less blindly calculating the correlation of the shorter scale with the total scale (highly inflated given they contain the some of the same items) and showing it together with the Cronbach’s alpha values in a scatterplot … for all possible combinations … and showing the amount of items via color. Looks like fishfood in an aquarium and the code is not that long (badly written, I admit). Just go through all possible combinations, write down the new means, then use this table as basis to determine the correlation, Cronbach’s alpha, and a few other values. ggplot handles the visualization. 😉
Cool.
(Whether it is useful is another question — it’s totally based on the data itself, and like written, heavily biased given the same items occur in both scales, with more overlap in longer scales. There’s more to a good scale than that. But still, cool, esp. given you can simply print out possible combinations based on, e.g., r > x, cronbach’s alpha > y, and amount of items <= z.)